
BADVIN vehicle history report for
2017 FORD MUSTANGVIN: 1FA6P8CF7H5286230
Get FULL ACCESS to the vehicle history report and see all blurred info.
⭐ Read 206+ reviews from our customers who used BADVIN to avoid buying junk vehicles.
Historical Records
events
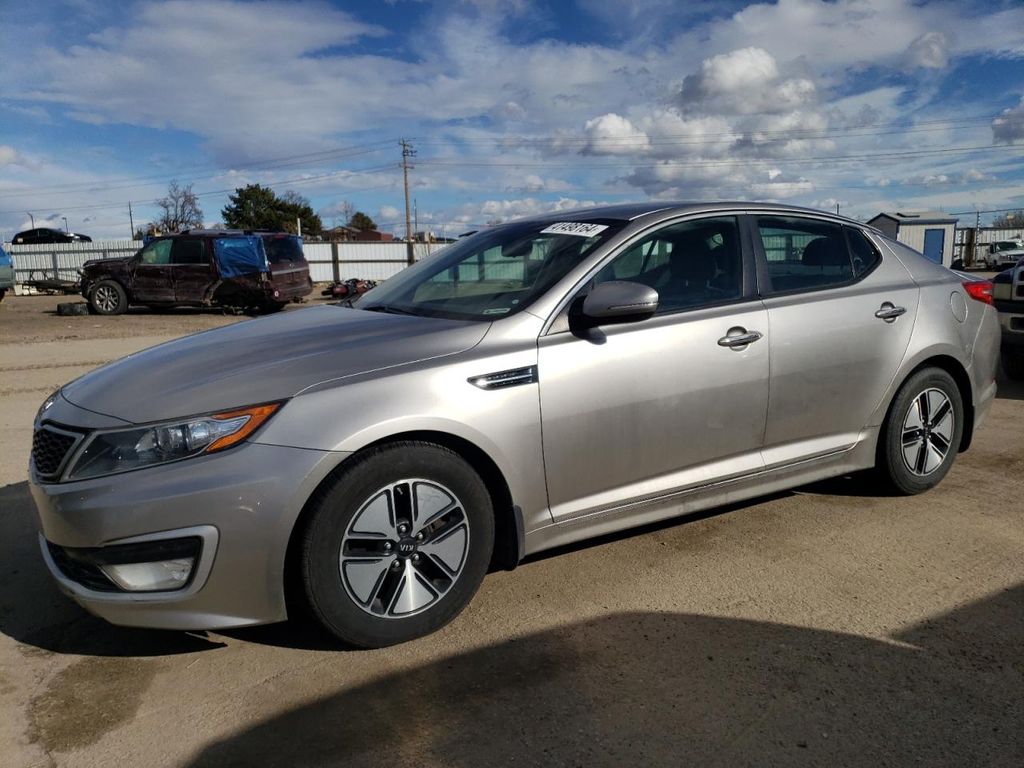
Photos
10 images
Sales History
1 records
Market report
Price analytics
Historical Records
Historical records may include service and maintenance records, title status (clean, junk, salvage), insurance records, number of owners, registration events and states, and other information.
You can find more information about historical records in BADVIN reports and see more examples here.
Available historical records for VIN 1FA6P8CF7H5286230
Latest reported mileage: 813 mi
Below you can see some examples of what these records could look like.
2023-02-26
a year ago
152,984 mi
Vehicle serviced
Maintenance inspection completed
Maintenance inspection completed
2022-04-24
2 years ago
13,124 mi
Vehicle sold
MILEAGE INCONSISTENCY
MILEAGE INCONSISTENCY
2020-12-28
3 years ago
49,293 mi
Duplicate title issued
REBUILT TITLE ISSUED
REBUILT TITLE ISSUED
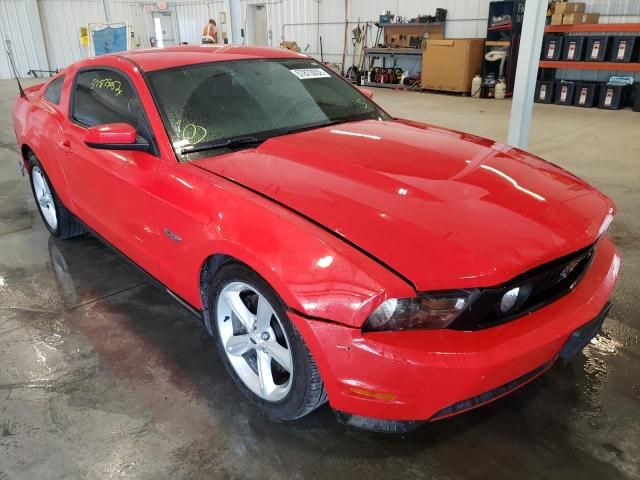
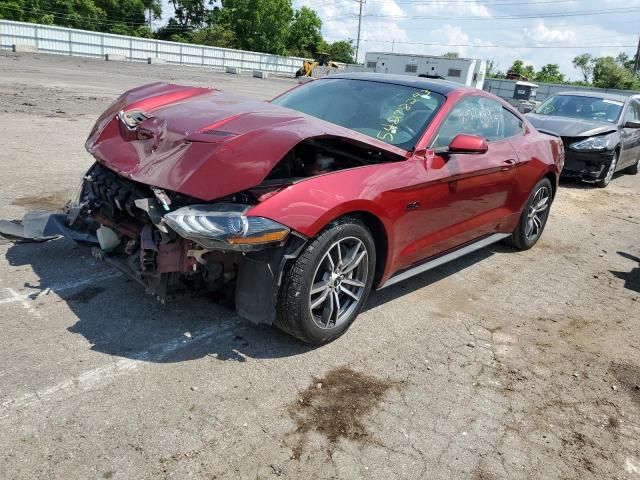
Sale Record
2017 FORD MUSTANG GT
sold
| Year | 2017 |
| Title | Hidden text (Hidden text) |
| ODO | 5389 mi (Hidden text) |
| Damage | Hidden text |
| Estimated Retail Value | $8172 |
| Estimated Repair Cost | $4318 (974%) |
| Location | Memphis, TN, 38114 |
| Date | ended 3 years ago |
| Sale Website Type | salvage or insurance auction |
sale information provided by user #368789


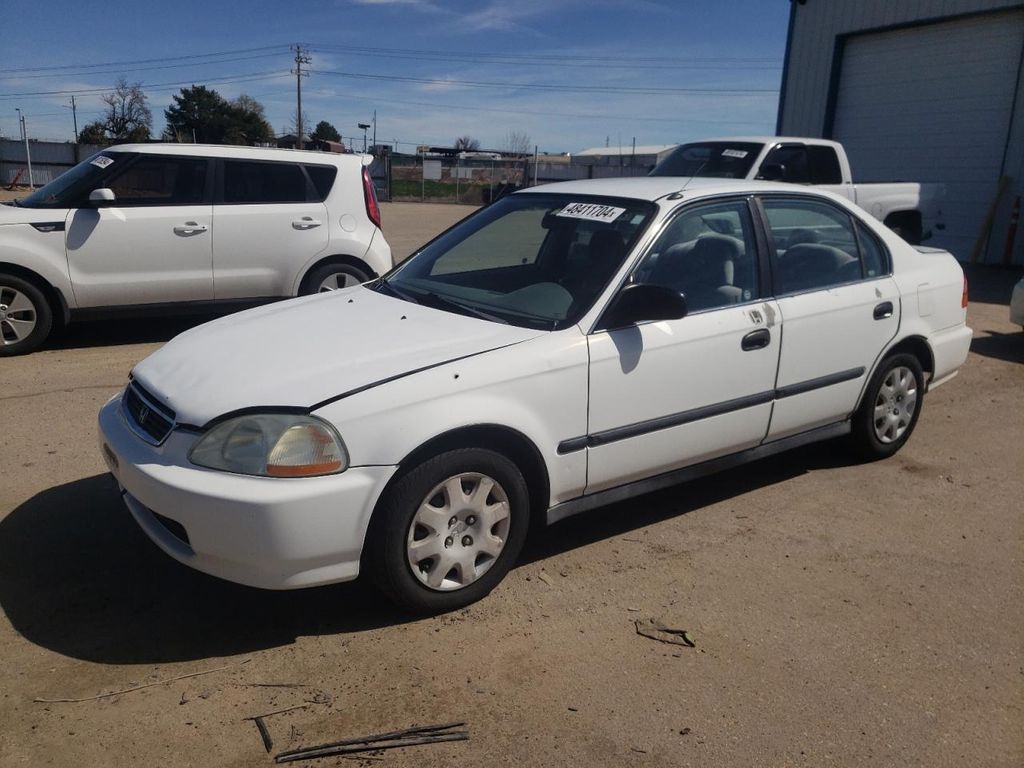
All photos above are REAL and display ACTUAL car. After you get the report you will see full resolution photos.
Tech Specs
| Color | WHITE |
| Transmission | AUTOMATIC |
| Engine | 5.0L 8 |
| Drive | Rear-wheel drive |
| Fuel Type | GAS |
Model Analytics & Market Report
We've analyzed more than 137,400 sales records of this model and here are some numbers.
The average price for new (MSRP) 2017 FORD MUSTANG in 2017 was $39,240.
The average price for used 2017 FORD MUSTANG nowadays in 2024 is $25,432 which is 65% from the original price.
Estimated mileage driven per year is 3,603 miles.
For this model we also have depreciation curve, photos, list of features and options, and other analytics.
Take a look at 2017 FORD MUSTANG model page in BADVIN vehicles catalog.
Depreciation
The graph below is a depreciation curve for 2017 FORD MUSTANG. It shows how much this model looses per year in price. This analytics is calculated using sales records from BADVIN database.
The table below shows average price for used 2017 FORD MUSTANG in each year since the year of manufacturing, current year price and projected price in the future years.
You can scroll the table horizontally to see all columns.
| Year | Average Mileage | Average Price | % Left | % Lost | ||
|---|---|---|---|---|---|---|
| 2017 MSRP | 0 mi | $39,240 | — | — | 100% | 0% |
| 2017 | 3,603 mi | $44,583 | −$5,343 | −13.62% | 113.62% | -13.62% |
| 2018 | 7,206 mi | $37,998 | +$6,585 | +14.77% | 96.83% | 3.17% |
| 2019 | 10,809 mi | $36,998 | +$1,000 | +2.63% | 94.29% | 5.71% |
| 2020 | 14,412 mi | $28,677 | +$8,321 | +22.49% | 73.08% | 26.92% |
| 2021 | 18,015 mi | $29,888 | −$1,211 | −4.22% | 76.17% | 23.83% |
| → Visit 2017 FORD MUSTANG depreciation page to see full data. | ||||||
Price vs Mileage
The graph below shows how mileage affects the price for 2017 FORD MUSTANG. This data was calculated using sales records from BADVIN database.
The table below shows average price for used 2017 FORD MUSTANG by mileage and number of sales.
You can scroll the table horizontally to see all columns.
| Mileage | Average Price | Sample Size |
|---|---|---|
| 0 mi | $65,208 | 22 sales |
| 5,000 mi | $57,995 | 123 sales |
| 10,000 mi | $45,250 | 198 sales |
| 15,000 mi | $34,998 | 266 sales |
| 20,000 mi | $32,923 | 222 sales |
| 25,000 mi | $31,715 | 265 sales |
| → Visit 2017 FORD MUSTANG depreciation page to see full data. | ||
Get FULL ACCESS to the vehicle history report and see all blurred info.
⭐ Read 206+ reviews from our customers who used BADVIN to avoid buying junk vehicles.
Testimonials from our customers
I've tried a bunch of different vehicle history reports over the years and badvin.org has been the most comprehensive by far. Stuff like service records, ownership history, lien and repo info that I haven't found elsewhere. Def go-to resource when shopping for used vehicles now.

Levi Johnson
verified on Trustpilot
Was shopping for a used Range Rover and found one that seemed suspiciously cheap. The badVIN report revealed it had been in a major front end collision, with photos showing the damage. Steered clear of that one and saved myself a ton of headaches!!
Ava Patel
verified on Trustpilot
I always rely on badvin to check out any used car before I buy. It gives such a complete history, including past accidents, service records, recalls and much more. Feel so much more confident as a used car shopper having this info.
Sofia Garcia
verified on Trustpilot
Was about to buy a used 2016 Camry but decided to get the badvin report first. Turns out the car had been in a serious crash and was declared a total loss by insurance, even tho carfax showed it as clean! Dodged a bullet on that one. ty badvin
Jessica Nguyen
verified on Trustpilot
Compare to other 2017 FORD MUSTANG

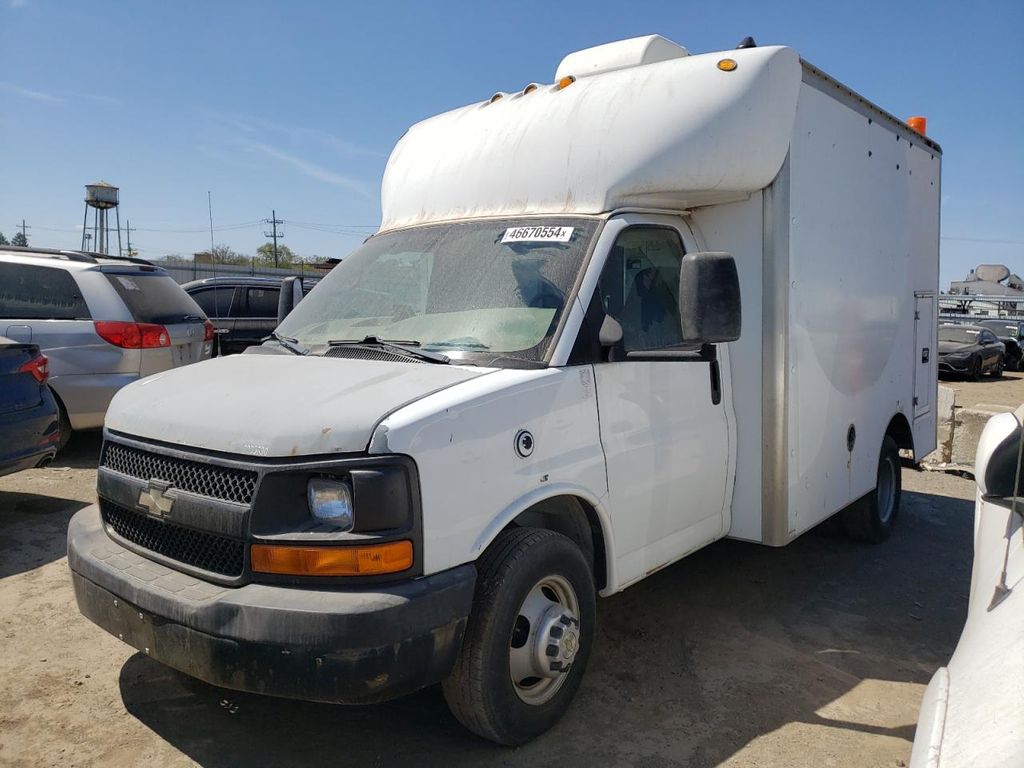
Other vehicles sales records
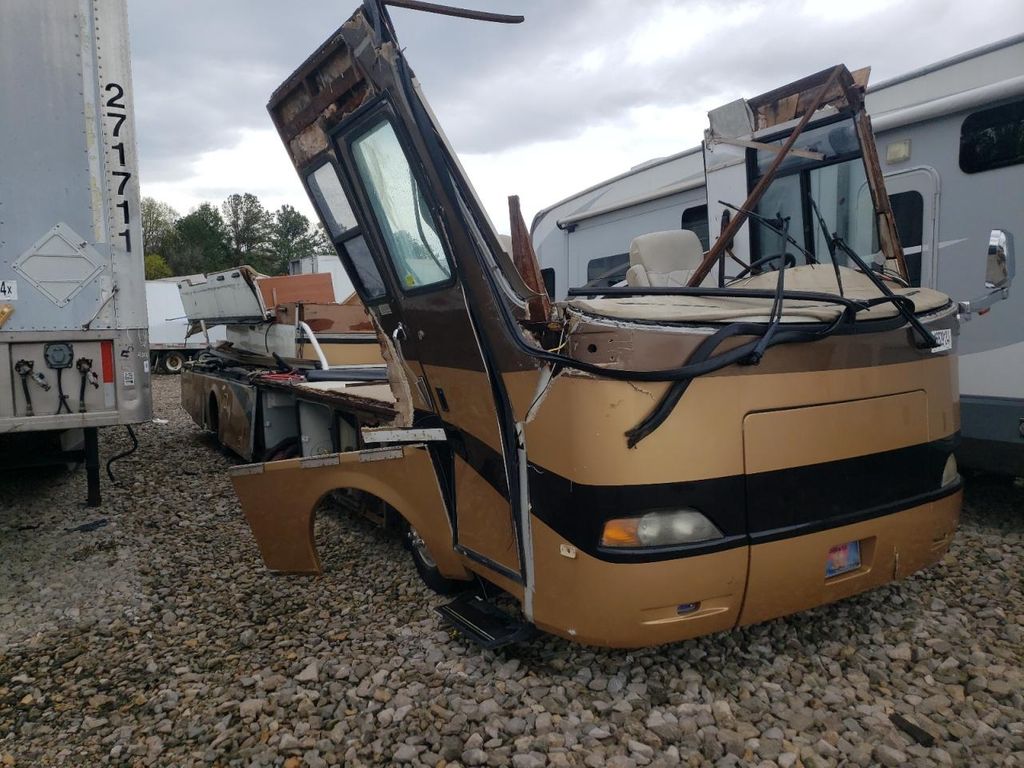


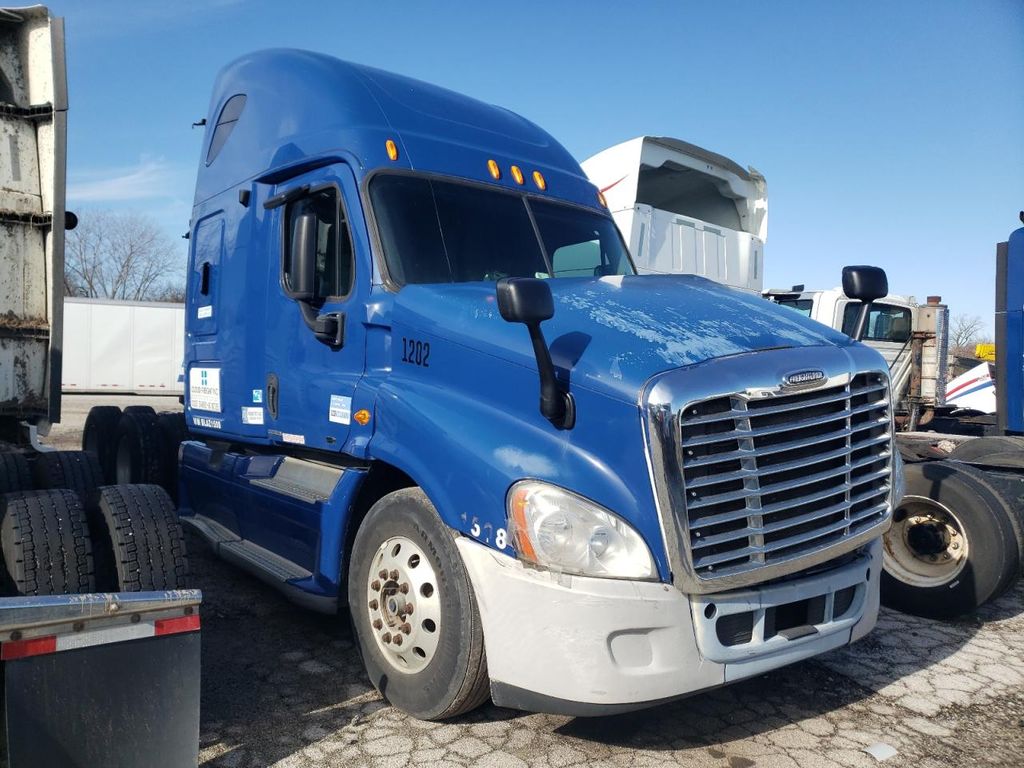
2011 FREIGHTLINER ALL OTHER
in 3 days, 668,674 mi
est retail value $26,875
buy now price $3,950
VIN 1FUJGLDR6BLAZ1508


2021 IC CORPORATION 3000 CE
in 3 days,
est retail value $77,500
buy now price $6,875
VIN 4DRBUC8P4MB273836
Frequently asked questions
Repossession records, if included, indicate if the 2017 FORD vehicle has been taken back by a lender due to payment defaults, which might affect its condition and value.
Use as a police or taxi vehicle, if noted, indicates high-intensity use which may affect the 2017 FORD vehicle's condition and lifespan, if such use is documented.
If the 2017 FORD was used as a taxi, this information may be noted in the vehicle history report, including the duration and any relevant details affecting its wear and tear, if reported.
Our vehicle history reports may indicate if the 2017 FORD vehicle was previously used in commercial services like a taxi or rental car, which may affect its condition and value, if such usage is recorded.
Our reports might include a service history, from oil changes to major overhauls, which can help you gauge the upkeep and condition of the 2017 FORD MUSTANG, depending on the records available.
You can use a Monroney label to compare different 2017 FORD models by reviewing their features, fuel economy, safety equipment, and pricing directly on the sticker.
You can track the depreciation of your car by monitoring market trends, checking online valuation tools, and staying informed about new model releases.
Water damage, if documented, is detailed with information on the extent and impact, affecting the 2017 FORD's electrical systems, engine, and overall functionality.


