
Depreciation
The depreciation graph and accompanying table on our page detail how the 2020 TOYOTA TUNDRA's price has changed annually.
For instance, while the car initially depreciated slightly in its first year, subsequent years show a significant decrease, reflecting market trends and vehicle condition over time.
Such precise data is crucial for understanding how age and market dynamics impact car values.
The average price for new (MSRP) 2020 TOYOTA TUNDRA in 2020 was $50,857.
The average price for used 2020 TOYOTA TUNDRA nowadays in 2024 is $40,764 which is 80% from the original price.
Estimated mileage driven per year is 11,272 miles.
The graph below is a depreciation curve for 2020 TOYOTA TUNDRA. It shows how much this model looses per year in price. This analytics is calculated using sales records from BADVIN database.
The table below shows average price for used 2020 TOYOTA TUNDRA in each year since the year of manufacturing, current year price and projected price in the future years.
You can scroll the table horizontally to see all columns.
| Year | Average Mileage | Average Price | % Left | % Lost | ||
|---|---|---|---|---|---|---|
| 2020 MSRP | 0 mi | $50,857 | — | — | 100% | 0% |
| 2020 | 11,272 mi | $59,999 | −$9,142 | −17.98% | 117.98% | -17.98% |
| 2021 | 22,544 mi | $56,989 | +$3,010 | +5.02% | 112.06% | -12.06% |
| 2022 | 33,816 mi | $48,974 | +$8,015 | +14.06% | 96.3% | 3.7% |
| 2023 | 45,088 mi | $42,729 | +$6,245 | +12.75% | 84.02% | 15.98% |
| 2024 | 56,360 mi | $40,764 | +$1,965 | +4.6% | 80.15% | 19.85% |
| 2025 | 67,632 mi | $38,500 | +$2,264 | +5.55% | 75.7% | 24.3% |
| 2026 | 78,904 mi | $35,499 | +$3,001 | +7.79% | 69.8% | 30.2% |
| 2027 | 90,176 mi | $32,990 | +$2,509 | +7.07% | 64.87% | 35.13% |
| 2028 | 101,448 mi | $29,981 | +$3,009 | +9.12% | 58.95% | 41.05% |
| 2029 | 112,720 mi | $27,988 | +$1,993 | +6.65% | 55.03% | 44.97% |
| 2030 | 123,992 mi | $25,606 | +$2,382 | +8.51% | 50.35% | 49.65% |
| 2031 | 135,264 mi | $21,990 | +$3,616 | +14.12% | 43.24% | 56.76% |
| 2032 | 146,536 mi | $19,980 | +$2,010 | +9.14% | 39.29% | 60.71% |
| 2033 | 157,808 mi | $17,990 | +$1,990 | +9.96% | 35.37% | 64.63% |
| 2034 | 169,080 mi | $16,635 | +$1,355 | +7.53% | 32.71% | 67.29% |
Price vs Mileage
Our comprehensive analysis does not stop at depreciation; it also covers how mileage affects the TOYOTA TUNDRA’s price.
With data showing detailed price points at various mileage milestones, this section helps in identifying trends and making informed decisions.
For instance, price drops at higher mileages compared to lower mileages provides insights into potential maintenance or value thresholds.
This block is particularly useful for buyers and sellers aiming to gauge the best value proposition based on vehicle mileage.
The graph below shows how mileage affects the price for 2020 TOYOTA TUNDRA. This data was calculated using sales records from BADVIN database.
The table below shows average price for used 2020 TOYOTA TUNDRA by mileage and number of sales.
You can scroll the table horizontally to see all columns.
| Mileage | Average Price | Sample Size |
|---|---|---|
| 5,000 mi | $44,997 | 19 sales |
| 10,000 mi | $45,711 | 85 sales |
| 15,000 mi | $44,887 | 171 sales |
| 20,000 mi | $44,915 | 309 sales |
| 25,000 mi | $44,101 | 446 sales |
| 30,000 mi | $43,831 | 672 sales |
| 35,000 mi | $42,995 | 763 sales |
| 40,000 mi | $42,586 | 667 sales |
| 45,000 mi | $41,914 | 589 sales |
| 50,000 mi | $41,090 | 641 sales |
| 55,000 mi | $39,998 | 550 sales |
| 60,000 mi | $39,990 | 478 sales |
| 65,000 mi | $38,475 | 345 sales |
| 70,000 mi | $37,995 | 262 sales |
| 75,000 mi | $37,840 | 225 sales |
| 80,000 mi | $36,989 | 150 sales |
| 85,000 mi | $35,984 | 109 sales |
| 90,000 mi | $35,909 | 102 sales |
| 95,000 mi | $36,696 | 96 sales |
| 100,000 mi | $34,641 | 52 sales |
| 105,000 mi | $30,746 | 50 sales |
| 110,000 mi | $34,000 | 43 sales |
| 115,000 mi | $32,900 | 21 sales |
| 120,000 mi | $32,314 | 11 sales |
| 125,000 mi | $29,998 | 33 sales |
| 130,000 mi | $29,988 | 15 sales |
| 135,000 mi | $32,493 | 18 sales |
Frequently asked questions
Some models may depreciate faster due to factors like lower demand, higher maintenance costs, or outdated technology compared to newer versions.
You can track the depreciation of your car by monitoring market trends, checking online valuation tools, and staying informed about new model releases.
Yes, the choice of vehicle color can impact the depreciation rate, with neutral colors typically being easier to sell and potentially holding their value better than more unconventional colors.
To minimize depreciation costs, consider purchasing a model known for retaining its value or opting for a slightly used vehicle that has already undergone initial depreciation.
High mileage typically accelerates the depreciation of a vehicle, as it may indicate increased wear and tear and potential future repairs.
Car depreciation is the decrease in value of a vehicle over time. It's a crucial factor to consider when calculating the total cost of vehicle ownership.
Aftermarket modifications can affect the depreciation of 2020 TOYOTA TUNDRA either positively, by enhancing appeal to certain buyers, or negatively, by deterring those who prefer stock condition.
Mileage is considered a major factor in the depreciation of vehicles because it directly correlates with the amount of use and potential wear and tear the vehicle has undergone.
The exterior and interior condition of vehicles significantly affects their depreciation, as well-maintained vehicles generally retain more value.
Advanced safety features can influence the resale value and slow the depreciation of vehicles by making them more attractive to safety-conscious buyers.
Other years of TOYOTA TUNDRA

2002 TOYOTA TUNDRA
$9,015 average used price
5,200+ sales records
2003 TOYOTA TUNDRA
$9,993 average used price
6,500+ sales records

2005 TOYOTA TUNDRA
$11,957 average used price
10,600+ sales records

2010 TOYOTA TUNDRA
$16,635 average used price
28,400+ sales records

2016 TOYOTA TUNDRA
$29,981 average used price
72,400+ sales records

2023 TOYOTA TUNDRA
$56,989 average used price
3,300+ sales records
Similar Models

2022 TOYOTA TACOMA
$37,100 MSRP
$37,742 average used price
85,500+ sales records

2022 TOYOTA SEQUOIA
$66,120 MSRP
$51,411 average used price
1,900+ sales records
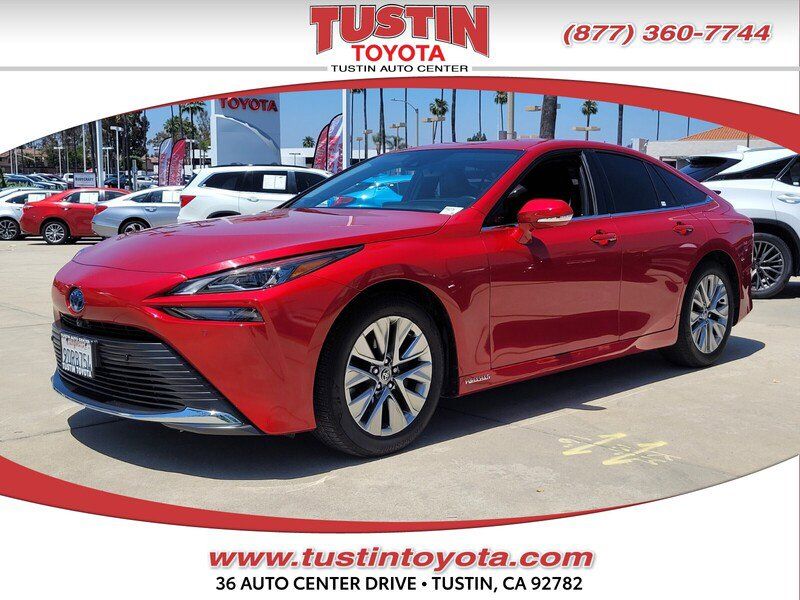
2022 TOYOTA MIRAI
$52,529 MSRP
$17,688 average used price
710+ sales records

2022 TOYOTA COROLLA
$21,900 MSRP
$20,988 average used price
104,800+ sales records

2022 TOYOTA 4RUNNER
$41,860 MSRP
$39,936 average used price
56,900+ sales records

2022 TOYOTA SIENNA
$38,660 MSRP
$41,457 average used price
26,400+ sales records


