Depreciation
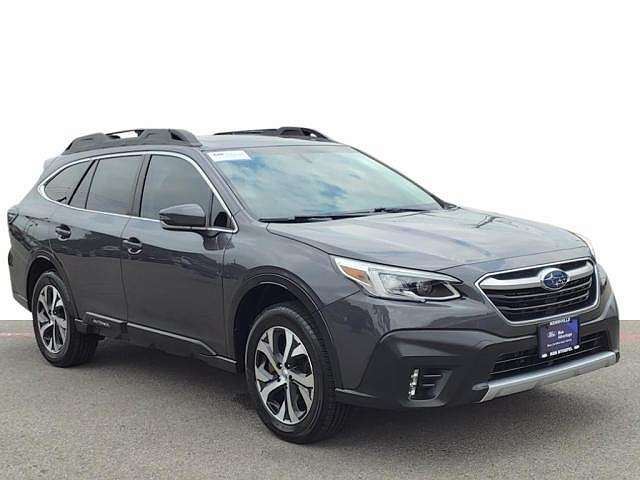
The depreciation graph and accompanying table on our page detail how the 2020 SUBARU OUTBACK's price has changed annually.
For instance, while the car initially depreciated slightly in its first year, subsequent years show a significant decrease, reflecting market trends and vehicle condition over time.
Such precise data is crucial for understanding how age and market dynamics impact car values.
The average price for new (MSRP) 2020 SUBARU OUTBACK in 2020 was $30,704.
The average price for used 2020 SUBARU OUTBACK nowadays in 2024 is $25,500 which is 83% from the original price.
Estimated mileage driven per year is 10,900 miles.
The graph below is a depreciation curve for 2020 SUBARU OUTBACK. It shows how much this model looses per year in price. This analytics is calculated using sales records from BADVIN database.
The table below shows average price for used 2020 SUBARU OUTBACK in each year since the year of manufacturing, current year price and projected price in the future years.
You can scroll the table horizontally to see all columns.
| Year | Average Mileage | Average Price | % Left | % Lost | ||
|---|---|---|---|---|---|---|
| 2020 MSRP | 0 mi | $30,704 | — | — | 100% | 0% |
| 2020 | 10,900 mi | $34,600 | −$3,896 | −12.69% | 112.69% | -12.69% |
| 2021 | 21,800 mi | $32,992 | +$1,608 | +4.65% | 107.45% | -7.45% |
| 2022 | 32,700 mi | $29,900 | +$3,092 | +9.37% | 97.38% | 2.62% |
| 2023 | 43,600 mi | $27,110 | +$2,790 | +9.33% | 88.29% | 11.71% |
| 2024 | 54,500 mi | $25,500 | +$1,610 | +5.94% | 83.05% | 16.95% |
| 2025 | 65,400 mi | $22,452 | +$3,048 | +11.95% | 73.12% | 26.88% |
| 2026 | 76,300 mi | $20,295 | +$2,157 | +9.61% | 66.1% | 33.9% |
| 2027 | 87,200 mi | $18,450 | +$1,845 | +9.09% | 60.09% | 39.91% |
| 2028 | 98,100 mi | $16,739 | +$1,711 | +9.27% | 54.52% | 45.48% |
| 2029 | 109,000 mi | $14,988 | +$1,751 | +10.46% | 48.81% | 51.19% |
| 2030 | 119,900 mi | $12,499 | +$2,489 | +16.61% | 40.71% | 59.29% |
| 2031 | 130,800 mi | $11,000 | +$1,499 | +11.99% | 35.83% | 64.17% |
| 2032 | 141,700 mi | $9,998 | +$1,002 | +9.11% | 32.56% | 67.44% |
| 2033 | 152,600 mi | $8,995 | +$1,003 | +10.03% | 29.3% | 70.7% |
| 2034 | 163,500 mi | $8,536 | +$459 | +5.1% | 27.8% | 72.2% |
Price vs Mileage
Our comprehensive analysis does not stop at depreciation; it also covers how mileage affects the SUBARU OUTBACK’s price.
With data showing detailed price points at various mileage milestones, this section helps in identifying trends and making informed decisions.
For instance, price drops at higher mileages compared to lower mileages provides insights into potential maintenance or value thresholds.
This block is particularly useful for buyers and sellers aiming to gauge the best value proposition based on vehicle mileage.
The graph below shows how mileage affects the price for 2020 SUBARU OUTBACK. This data was calculated using sales records from BADVIN database.
The table below shows average price for used 2020 SUBARU OUTBACK by mileage and number of sales.
You can scroll the table horizontally to see all columns.
| Mileage | Average Price | Sample Size |
|---|---|---|
| 5,000 mi | $28,998 | 25 sales |
| 10,000 mi | $28,990 | 66 sales |
| 15,000 mi | $27,998 | 203 sales |
| 20,000 mi | $27,827 | 331 sales |
| 25,000 mi | $26,998 | 449 sales |
| 30,000 mi | $26,680 | 592 sales |
| 35,000 mi | $26,495 | 681 sales |
| 40,000 mi | $25,998 | 629 sales |
| 45,000 mi | $25,949 | 537 sales |
| 50,000 mi | $25,000 | 482 sales |
| 55,000 mi | $24,999 | 487 sales |
| 60,000 mi | $23,999 | 390 sales |
| 65,000 mi | $23,906 | 288 sales |
| 70,000 mi | $23,500 | 236 sales |
| 75,000 mi | $23,106 | 218 sales |
| 80,000 mi | $22,494 | 148 sales |
| 85,000 mi | $21,946 | 114 sales |
| 90,000 mi | $21,498 | 93 sales |
| 95,000 mi | $21,296 | 75 sales |
| 100,000 mi | $20,331 | 50 sales |
| 105,000 mi | $19,750 | 28 sales |
| 110,000 mi | $19,975 | 19 sales |
| 115,000 mi | $18,799 | 15 sales |
| 120,000 mi | $20,500 | 13 sales |
| 130,000 mi | $18,995 | 12 sales |
Frequently asked questions
Proper maintenance and good condition can slow the depreciation of a 2020 SUBARU OUTBACK by making it more attractive to potential buyers, thereby preserving more of its value.
When buying a car, consider models with strong resale histories, opt for popular color and feature options, and evaluate current market trends for the best value retention.
The economic climate can significantly affect the depreciation of vehicles, with higher demand and better economic conditions typically slowing depreciation rates.
Car depreciation is the decrease in value of a vehicle over time. It's a crucial factor to consider when calculating the total cost of vehicle ownership.
Keeping your vehicle for about three to five years can optimize its resale value, balancing depreciation with usage and maintenance costs.
You can track the depreciation of your car by monitoring market trends, checking online valuation tools, and staying informed about new model releases.
The depreciation rate can be influenced by factors such as the vehicle's condition, mileage, market demand, and the pace of technological advancements in newer models.
Technology plays a significant role in the depreciation of vehicles, as models with outdated tech depreciate faster due to lower consumer demand for older features.
Economic downturns can lead to decreased demand and lower resale values for vehicles, as buyers may defer purchasing vehicles or opt for less expensive alternatives.
Some models may depreciate faster due to factors like lower demand, higher maintenance costs, or outdated technology compared to newer versions.
Other years of SUBARU OUTBACK

2004 SUBARU OUTBACK
$4,995 average used price
2,200+ sales records
2009 SUBARU OUTBACK
$8,150 average used price
8,200+ sales records

2013 SUBARU OUTBACK
$11,000 average used price
41,700+ sales records
2015 SUBARU OUTBACK
$14,988 average used price
47,900+ sales records

2022 SUBARU OUTBACK
$29,900 average used price
65,500+ sales records

2024 SUBARU OUTBACK
$34,600 average used price
8,600+ sales records
Similar Models

2020 SUBARU WRX
$31,595 MSRP
$26,500 average used price
39,400+ sales records

2020 SUBARU FORESTER
$27,395 MSRP
$24,744 average used price
144,900+ sales records

2020 SUBARU IMPREZA
$21,995 MSRP
$19,878 average used price
49,600+ sales records

2022 SUBARU CROSSTREK
$26,495 MSRP
$26,889 average used price
21,000+ sales records

2023 SUBARU CROSSTREK
$26,495 MSRP
$27,700 average used price
860+ sales records

2023 SUBARU WRX
$31,595 MSRP
$31,990 average used price
490+ sales records
2020 SUBARU OUTBACK on BADVIN