Depreciation
The depreciation graph and accompanying table on our page detail how the 2011 KIA SORENTO's price has changed annually.
For instance, while the car initially depreciated slightly in its first year, subsequent years show a significant decrease, reflecting market trends and vehicle condition over time.
Such precise data is crucial for understanding how age and market dynamics impact car values.
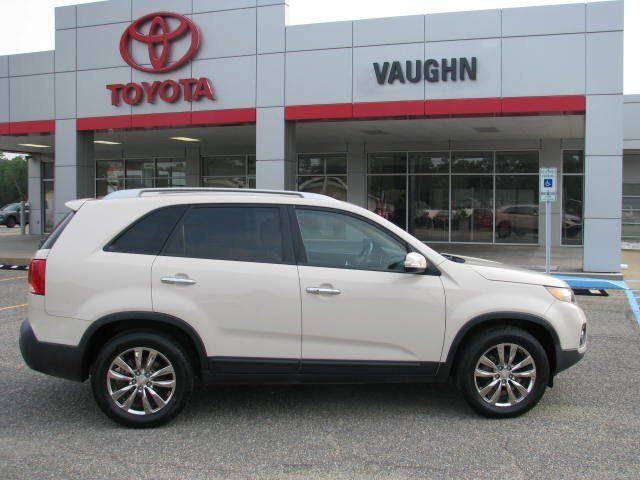
The average price for new (MSRP) 2011 KIA SORENTO in 2011 was $27,945.
The average price for used 2011 KIA SORENTO nowadays in 2024 is $7,250 which is 26% from the original price.
Estimated mileage driven per year is 11,810 miles.
The graph below is a depreciation curve for 2011 KIA SORENTO. It shows how much this model looses per year in price. This analytics is calculated using sales records from BADVIN database.
The table below shows average price for used 2011 KIA SORENTO in each year since the year of manufacturing, current year price and projected price in the future years.
You can scroll the table horizontally to see all columns.
| Year | Average Mileage | Average Price | % Left | % Lost | ||
|---|---|---|---|---|---|---|
| 2011 MSRP | 0 mi | $27,945 | — | — | 100% | 0% |
| 2011 | 11,810 mi | $42,623 | −$14,678 | −52.52% | 152.52% | -52.52% |
| 2012 | 23,620 mi | $33,777 | +$8,846 | +20.75% | 120.87% | -20.87% |
| 2013 | 35,430 mi | $30,998 | +$2,779 | +8.23% | 110.93% | -10.93% |
| 2014 | 47,240 mi | $28,500 | +$2,498 | +8.06% | 101.99% | -1.99% |
| 2015 | 59,050 mi | $20,437 | +$8,063 | +28.29% | 73.13% | 26.87% |
| 2016 | 70,860 mi | $18,490 | +$1,947 | +9.53% | 66.17% | 33.83% |
| 2017 | 82,670 mi | $16,998 | +$1,492 | +8.07% | 60.83% | 39.17% |
| 2018 | 94,480 mi | $15,000 | +$1,998 | +11.75% | 53.68% | 46.32% |
| 2019 | 106,290 mi | $13,985 | +$1,015 | +6.77% | 50.04% | 49.96% |
| 2020 | 118,100 mi | $11,999 | +$1,986 | +14.2% | 42.94% | 57.06% |
| 2021 | 129,910 mi | $10,995 | +$1,004 | +8.37% | 39.35% | 60.65% |
| 2022 | 141,720 mi | $9,446 | +$1,549 | +14.09% | 33.8% | 66.2% |
| 2023 | 153,530 mi | $8,991 | +$455 | +4.82% | 32.17% | 67.83% |
| 2024 | 165,340 mi | $7,250 | +$1,741 | +19.36% | 25.94% | 74.06% |
Price vs Mileage
Our comprehensive analysis does not stop at depreciation; it also covers how mileage affects the KIA SORENTO’s price.
With data showing detailed price points at various mileage milestones, this section helps in identifying trends and making informed decisions.
For instance, price drops at higher mileages compared to lower mileages provides insights into potential maintenance or value thresholds.
This block is particularly useful for buyers and sellers aiming to gauge the best value proposition based on vehicle mileage.
The graph below shows how mileage affects the price for 2011 KIA SORENTO. This data was calculated using sales records from BADVIN database.
The table below shows average price for used 2011 KIA SORENTO by mileage and number of sales.
You can scroll the table horizontally to see all columns.
| Mileage | Average Price | Sample Size |
|---|---|---|
| 30,000 mi | $17,590 | 41 sales |
| 35,000 mi | $12,900 | 13 sales |
| 40,000 mi | $15,990 | 67 sales |
| 45,000 mi | $11,475 | 20 sales |
| 50,000 mi | $11,998 | 28 sales |
| 55,000 mi | $11,500 | 30 sales |
| 60,000 mi | $12,985 | 62 sales |
| 65,000 mi | $12,984 | 67 sales |
| 70,000 mi | $10,999 | 88 sales |
| 75,000 mi | $13,590 | 130 sales |
| 80,000 mi | $10,950 | 83 sales |
| 85,000 mi | $10,995 | 122 sales |
| 90,000 mi | $10,688 | 129 sales |
| 95,000 mi | $10,523 | 156 sales |
| 100,000 mi | $9,283 | 140 sales |
| 105,000 mi | $9,492 | 166 sales |
| 110,000 mi | $9,461 | 191 sales |
| 115,000 mi | $8,995 | 137 sales |
| 120,000 mi | $8,995 | 199 sales |
| 125,000 mi | $8,599 | 195 sales |
| 130,000 mi | $7,999 | 181 sales |
| 135,000 mi | $7,998 | 148 sales |
| 140,000 mi | $7,612 | 160 sales |
| 145,000 mi | $7,800 | 167 sales |
| 150,000 mi | $7,350 | 146 sales |
| 155,000 mi | $7,250 | 155 sales |
| 160,000 mi | $6,500 | 119 sales |
| 165,000 mi | $6,490 | 116 sales |
| 170,000 mi | $6,250 | 124 sales |
| 175,000 mi | $6,500 | 79 sales |
| 180,000 mi | $5,993 | 90 sales |
| 185,000 mi | $5,925 | 80 sales |
| 190,000 mi | $5,500 | 75 sales |
| 195,000 mi | $5,500 | 51 sales |
| 200,000 mi | $5,711 | 32 sales |
| 205,000 mi | $4,999 | 47 sales |
| 210,000 mi | $4,995 | 31 sales |
| 215,000 mi | $4,999 | 21 sales |
| 220,000 mi | $4,990 | 19 sales |
| 225,000 mi | $5,000 | 15 sales |
| 230,000 mi | $3,994 | 14 sales |
| 235,000 mi | $4,988 | 13 sales |
Frequently asked questions
The average depreciation rate for vehicles over five years can vary, but many models experience a significant portion of their depreciation within the first few years of ownership.
On average, a new car can depreciate by approximately 23% after the first year, reflecting the premium paid for new technology and immediate depreciation once it's considered used.
Buying a used car can be a great value, especially if the vehicle is part of a Certified Pre-Owned program and has been well-maintained and lightly used.
Advanced safety features can influence the resale value and slow the depreciation of vehicles by making them more attractive to safety-conscious buyers.
When buying a car, consider models with strong resale histories, opt for popular color and feature options, and evaluate current market trends for the best value retention.
The market value of a vehicle is calculated based on its historical depreciation trends, current condition, mileage, and market trends.
To maximize value, consider buying a vehicle that is a few years old, as it has already undergone significant depreciation but likely remains reliable.
Strategies to reduce the rate of depreciation include regular maintenance, keeping mileage low, avoiding significant modifications, and keeping up with all necessary repairs.
The exterior and interior condition of vehicles significantly affects their depreciation, as well-maintained vehicles generally retain more value.
High mileage typically accelerates the depreciation of a vehicle, as it may indicate increased wear and tear and potential future repairs.
Other years of KIA SORENTO
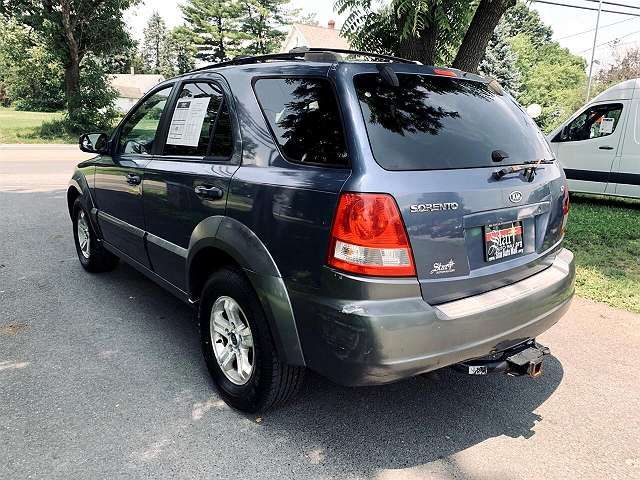
2003 KIA SORENTO
$3,999 average used price
930+ sales records

2005 KIA SORENTO
$4,995 average used price
2,600+ sales records

2016 KIA SORENTO
$13,985 average used price
94,500+ sales records

2018 KIA SORENTO
$16,998 average used price
61,200+ sales records

2024 KIA SORENTO
$42,623 average used price
3,000+ sales records

2025 KIA SORENTO
160+ sales records
Similar Models

2011 KIA OPTIMA
$13,998 MSRP
$7,995 average used price
13,500+ sales records

2011 KIA FORTE
$22,145 MSRP
$6,400 average used price
7,700+ sales records

2011 KIA RONDO
$7,550 MSRP
10+ sales records

2012 KIA SOUL
$19,723 MSRP
$7,887 average used price
24,300+ sales records

2013 KIA OPTIMA
$13,998 MSRP
$9,749 average used price
60,900+ sales records

2014 KIA FORTE
$22,145 MSRP
$8,600 average used price
26,700+ sales records
2011 KIA SORENTO on BADVIN