Depreciation
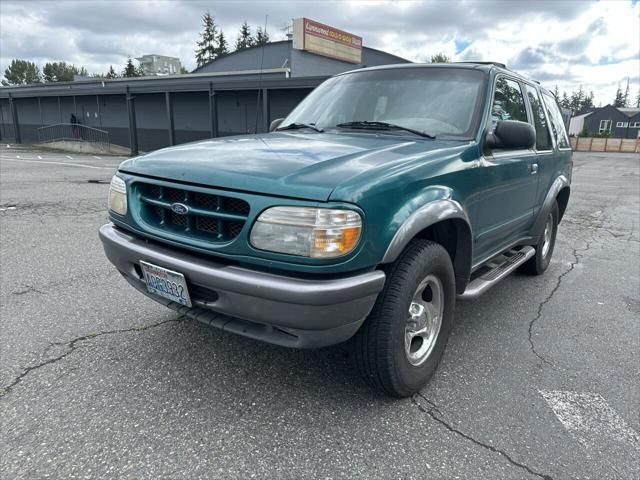
The depreciation graph and accompanying table on our page detail how the 1998 FORD EXPLORER's price has changed annually.
For instance, while the car initially depreciated slightly in its first year, subsequent years show a significant decrease, reflecting market trends and vehicle condition over time.
Such precise data is crucial for understanding how age and market dynamics impact car values.
The average price for new (MSRP) 1998 FORD EXPLORER in 1998 was $43,180.
The average price for used 1998 FORD EXPLORER nowadays in 2024 is $5,250 which is 12% from the original price.
Estimated mileage driven per year is 10,414 miles.
The graph below is a depreciation curve for 1998 FORD EXPLORER. It shows how much this model looses per year in price. This analytics is calculated using sales records from BADVIN database.
The table below shows average price for used 1998 FORD EXPLORER in each year since the year of manufacturing, current year price and projected price in the future years.
You can scroll the table horizontally to see all columns.
| Year | Average Mileage | Average Price | % Left | % Lost | ||
|---|---|---|---|---|---|---|
| 1998 MSRP | 0 mi | $43,180 | — | — | 100% | 0% |
| 1998 | 10,414 mi | $46,166 | −$2,986 | −6.92% | 106.92% | -6.92% |
| 1999 | 20,828 mi | $38,000 | +$8,166 | +17.69% | 88% | 12% |
| 2000 | 31,242 mi | $34,383 | +$3,617 | +9.52% | 79.63% | 20.37% |
| 2001 | 41,656 mi | $30,995 | +$3,388 | +9.85% | 71.78% | 28.22% |
| 2002 | 52,070 mi | $28,998 | +$1,997 | +6.44% | 67.16% | 32.84% |
| 2003 | 62,484 mi | $23,988 | +$5,010 | +17.28% | 55.55% | 44.45% |
| 2004 | 72,898 mi | $21,500 | +$2,488 | +10.37% | 49.79% | 50.21% |
| 2005 | 83,312 mi | $18,995 | +$2,505 | +11.65% | 43.99% | 56.01% |
| 2006 | 93,726 mi | $16,999 | +$1,996 | +10.51% | 39.37% | 60.63% |
| 2007 | 104,140 mi | $15,000 | +$1,999 | +11.76% | 34.74% | 65.26% |
| 2008 | 114,554 mi | $13,800 | +$1,200 | +8% | 31.96% | 68.04% |
| 2009 | 124,968 mi | $11,973 | +$1,827 | +13.24% | 27.73% | 72.27% |
| 2010 | 135,382 mi | $11,163 | +$810 | +6.77% | 25.85% | 74.15% |
| 2011 | 145,796 mi | $10,000 | +$1,163 | +10.42% | 23.16% | 76.84% |
| 2012 | 156,210 mi | $9,786 | +$214 | +2.14% | 22.66% | 77.34% |
Price vs Mileage
Our comprehensive analysis does not stop at depreciation; it also covers how mileage affects the FORD EXPLORER’s price.
With data showing detailed price points at various mileage milestones, this section helps in identifying trends and making informed decisions.
For instance, price drops at higher mileages compared to lower mileages provides insights into potential maintenance or value thresholds.
This block is particularly useful for buyers and sellers aiming to gauge the best value proposition based on vehicle mileage.
The graph below shows how mileage affects the price for 1998 FORD EXPLORER. This data was calculated using sales records from BADVIN database.
The table below shows average price for used 1998 FORD EXPLORER by mileage and number of sales.
You can scroll the table horizontally to see all columns.
| Mileage | Average Price | Sample Size |
|---|---|---|
| 65,000 mi | $6,987 | 14 sales |
| 75,000 mi | $6,800 | 13 sales |
| 80,000 mi | $5,995 | 37 sales |
| 85,000 mi | $5,995 | 13 sales |
| 90,000 mi | $5,995 | 21 sales |
| 95,000 mi | $5,245 | 22 sales |
| 100,000 mi | $4,375 | 27 sales |
| 105,000 mi | $4,444 | 22 sales |
| 110,000 mi | $3,789 | 28 sales |
| 115,000 mi | $4,500 | 40 sales |
| 120,000 mi | $3,990 | 29 sales |
| 125,000 mi | $3,250 | 33 sales |
| 130,000 mi | $3,995 | 54 sales |
| 135,000 mi | $3,988 | 51 sales |
| 140,000 mi | $3,980 | 36 sales |
| 145,000 mi | $3,490 | 23 sales |
| 150,000 mi | $3,150 | 42 sales |
| 155,000 mi | $3,593 | 50 sales |
| 160,000 mi | $2,895 | 47 sales |
| 165,000 mi | $3,995 | 47 sales |
| 170,000 mi | $2,600 | 38 sales |
| 175,000 mi | $3,192 | 50 sales |
| 180,000 mi | $2,500 | 37 sales |
| 185,000 mi | $2,987 | 34 sales |
| 190,000 mi | $2,898 | 50 sales |
| 195,000 mi | $3,788 | 33 sales |
| 200,000 mi | $2,995 | 47 sales |
| 205,000 mi | $2,750 | 29 sales |
| 210,000 mi | $3,088 | 27 sales |
| 215,000 mi | $3,421 | 23 sales |
| 220,000 mi | $2,500 | 19 sales |
| 225,000 mi | $2,500 | 25 sales |
| 230,000 mi | $3,000 | 17 sales |
| 235,000 mi | $3,997 | 20 sales |
| 240,000 mi | $2,999 | 13 sales |
| 245,000 mi | $2,976 | 11 sales |
| 255,000 mi | $2,995 | 17 sales |
| 265,000 mi | $2,898 | 12 sales |
| 290,000 mi | $2,971 | 13 sales |
Frequently asked questions
Proper maintenance and good condition can slow the depreciation of a 1998 FORD EXPLORER by making it more attractive to potential buyers, thereby preserving more of its value.
A CPO vehicle offers the reliability of a new car at a lower price, backed by a comprehensive warranty, making it a great option for those seeking value and peace of mind.
The economic climate can significantly affect the depreciation of vehicles, with higher demand and better economic conditions typically slowing depreciation rates.
High mileage typically accelerates the depreciation of a vehicle, as it may indicate increased wear and tear and potential future repairs.
The depreciation rate can be influenced by factors such as the vehicle's condition, mileage, market demand, and the pace of technological advancements in newer models.
You can track the depreciation of your car by monitoring market trends, checking online valuation tools, and staying informed about new model releases.
The exterior and interior condition of vehicles significantly affects their depreciation, as well-maintained vehicles generally retain more value.
Factors to consider when estimating the future resale value include the car's historical depreciation rate, current market trends, overall vehicle condition, and mileage.
Strategies to reduce the rate of depreciation include regular maintenance, keeping mileage low, avoiding significant modifications, and keeping up with all necessary repairs.
Yes, the choice of vehicle color can impact the depreciation rate, with neutral colors typically being easier to sell and potentially holding their value better than more unconventional colors.
Other years of FORD EXPLORER

1995 FORD EXPLORER
$3,500 average used price
540+ sales records

2001 FORD EXPLORER
$5,482 average used price
4,300+ sales records

2002 FORD EXPLORER
$4,995 average used price
10,700+ sales records

2009 FORD EXPLORER
$8,885 average used price
5,200+ sales records

2016 FORD EXPLORER
$16,999 average used price
159,000+ sales records

2018 FORD EXPLORER
$21,500 average used price
208,700+ sales records
Similar Models

2000 FORD ESCORT
$4,500 MSRP
$3,997 average used price
260+ sales records

2000 FORD OTHER
$31,710 MSRP
$9,000 average used price
450+ sales records

2000 FORD EXCURSION
$18,457 MSRP
$11,995 average used price
5,200+ sales records

2001 FORD CROWN VICTORIA
$28,860 MSRP
$5,500 average used price
690+ sales records

2001 FORD MUSTANG
$39,240 MSRP
$14,500 average used price
8,600+ sales records
2001 FORD ECONOLINE
$30,978 MSRP
$10,490 average used price
620+ sales records
1998 FORD EXPLORER on BADVIN