
BADVIN vehicle history report for
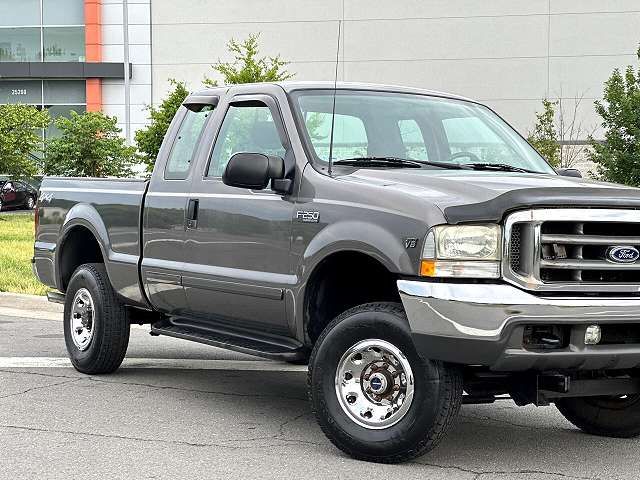
2016 FORD F-250VIN: 1FT7W2BT4GEB24625
Get FULL ACCESS to the vehicle history report and see all blurred info.
⭐ Read 206+ reviews from our customers who used BADVIN to avoid buying junk vehicles.
Historical Records
18 events
Sales History
1 records
Market report
Price analytics
Historical Records
Historical records may include service and maintenance records, title status (clean, junk, salvage), insurance records, number of owners, registration events and states, and other information.
You can find more information about historical records in BADVIN reports and see more examples here.
Available 18 historical records for VIN 1FT7W2BT4GEB24625
Latest reported mileage: 9871 mi
Below you can see some examples of what these records could look like.
2023-03-20
a year ago
33,354 mi
Damage reported
Damage to front
Damage to front
2021-12-08
3 years ago
17,287 mi
Odometer reading reported
2019-09-11
5 years ago
43,149 mi
Accident reported
Vehicle involved in a sideswipe collision with another motor vehicle
Airbag deployed
Vehicle involved in a sideswipe collision with another motor vehicle
Airbag deployed
Sale Record
| Year | 2016 |
| ODO | 5412 mi |
| Condition | Hidden text |
| Seller | Hidden text |
| Location | Lufkin, TX, 75901 |
| Date | appeared 2 years ago |
| Sale Website Type | classifieds |
sale information provided by user #186398
Tech Specs
| Body Style | Pickup |
| Color | Red |
| Transmission | Automatic |
| Engine | 6.7 L |
| Cylinders | 8 Cyl |
| Drive | 4WD |
| Fuel Type | Diesel |
Standard Features
All these features are based on a model in general. This specific vehicle may differ.
- HD
Model Analytics & Market Report
We've analyzed more than 73,300 sales records of this model and here are some numbers.
The average price for new (MSRP) 2016 FORD F-250 in 2016 was $60,650.
The average price for used 2016 FORD F-250 nowadays in 2024 is $34,712 which is 57% from the original price.
Estimated mileage driven per year is 10,365 miles.
For this model we also have depreciation curve, photos, list of features and options, and other analytics.
Take a look at 2016 FORD F-250 model page in BADVIN vehicles catalog.
Depreciation
The graph below is a depreciation curve for 2016 FORD F-250. It shows how much this model looses per year in price. This analytics is calculated using sales records from BADVIN database.
The table below shows average price for used 2016 FORD F-250 in each year since the year of manufacturing, current year price and projected price in the future years.
You can scroll the table horizontally to see all columns.
| Year | Average Mileage | Average Price | % Left | % Lost | ||
|---|---|---|---|---|---|---|
| 2016 MSRP | 0 mi | $60,650 | — | — | 100% | 0% |
| 2016 | 10,365 mi | $88,472 | −$27,822 | −45.87% | 145.87% | -45.87% |
| 2017 | 20,730 mi | $77,996 | +$10,476 | +11.84% | 128.6% | -28.6% |
| 2018 | 31,095 mi | $59,657 | +$18,339 | +23.51% | 98.36% | 1.64% |
| 2019 | 41,460 mi | $55,995 | +$3,662 | +6.14% | 92.32% | 7.68% |
| 2020 | 51,825 mi | $53,747 | +$2,248 | +4.01% | 88.62% | 11.38% |
| → Visit 2016 FORD F-250 depreciation page to see full data. | ||||||
Price vs Mileage
The graph below shows how mileage affects the price for 2016 FORD F-250. This data was calculated using sales records from BADVIN database.
The table below shows average price for used 2016 FORD F-250 by mileage and number of sales.
You can scroll the table horizontally to see all columns.
| Mileage | Average Price | Sample Size |
|---|---|---|
| 10,000 mi | $32,900 | 10 sales |
| 15,000 mi | $35,900 | 30 sales |
| 20,000 mi | $33,997 | 34 sales |
| 25,000 mi | $38,248 | 46 sales |
| 30,000 mi | $37,299 | 40 sales |
| 35,000 mi | $34,136 | 52 sales |
| → Visit 2016 FORD F-250 depreciation page to see full data. | ||
Get FULL ACCESS to the vehicle history report and see all blurred info.
⭐ Read 206+ reviews from our customers who used BADVIN to avoid buying junk vehicles.
Testimonials from our customers
I almost bought a 2019 Malibu that seemed like a great deal - low miles and price. But the badvin report showed it used to be a rental fleet vehicle, which the seller didn't disclose. Glad I found out before buying someone else's abused rental!

Benjamin Torres
verified on Trustpilot
I've tried many vehicle reports but badvin's is by far the most comprehensive. It shows accident photos, past sales, repairs and so much more. I won't buy a car now without getting a report first. It's a must-have.
Alexander Hunt
verified on Trustpilot
Bad Vin's vehicle history report showed that the 2018 Audi A4 I was about to buy had been in a major accident that was not disclosed by the seller. The severity analysis helped me avoid a bad purchase. Great service!
Sophie Dubois
verified on Trustpilot
As a broke college kid I almost settled for a sketchy 2005 Altima cuz it was cheap. but splurged on the report from badvin 1st. soooo glad I did - turned out it had been totalled and rebuilt. spending a little saved me from wasting $1000s!
Sophie
verified on Trustpilot
Compare to other 2016 FORD F-250


Other vehicles sales records


Frequently asked questions
Yes, in many cases, you can determine the type of drivetrain a 2016 FORD F-250 has from its VIN if the manufacturer encodes this information within the VIN.
An insurance check can reveal past claims, typically related to accident damage, which might indicate underlying issues not apparent in a physical inspection, if such information is available.
Depreciation, which reflects the decline in a 2016 FORD vehicle's value over time due to factors like age, mileage, and condition, may directly impact its resale value, based on recorded information.
Discrepancies between a window sticker and actual dealer pricing can occur due to additional dealer markup, optional add-ons not included in the sticker, or regional pricing differences.
The Monroney label can indirectly reflect the resale value of 2016 FORD vehicles by detailing features and specifications that are valued in the used car market.
Window stickers for luxury 2016 FORD models often include unique information such as high-end options, advanced technological features, and premium materials, reflecting the upscale positioning of these vehicles.


